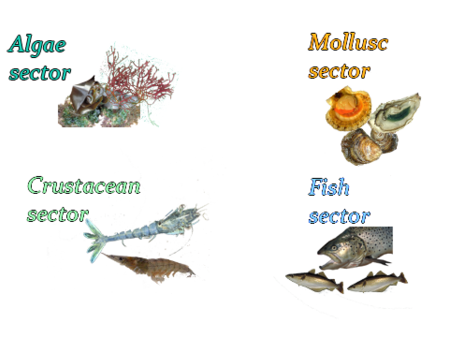
Production per species group
Aquacultural production per major species group in 2005
In quantity
These production data are expressed in total live weight; for fish this is the weight of whole animals; for plants this is wet weight; for molluscs the shell is included; and for crustaceans this is live weight.
Production of algae and crustaceans has grown strongly (compared with 2004) while that of molluscs has started to level off (+ 2.3 % only). The increase in fish production corresponds to the overall increase in world aquaculture (5 %).
In value
The values in the black circles represent the mean value per kg (US $ / kg): fish 1.41, plants 0.48, molluscs 0.84, crustaceans 4.30, and other 3.36. These “average prices” hide many disparities. For example, the algae grown for derived products, like alginates, have a lesser value than those grown for food e.g. nori, wakamé and kombu.
Fish dominate over the other species. It should be noted however that crustaceans, which are 4th in terms of quantity (6.3%), move to second place in terms of value (20%), influenced by aquacultural production that is essentially for the export market.
FA0 2007 (2005 data)

